Why Go Handles Millions of Connections: User-Space Context Switching, Explained
Go isn't magic and it isn't faster than Java. It just stops asking the kernel to help. A first-principles look at goroutines, 2KB stacks, and why high-frequency trading engines chase the exact same answer.
Table of Contents
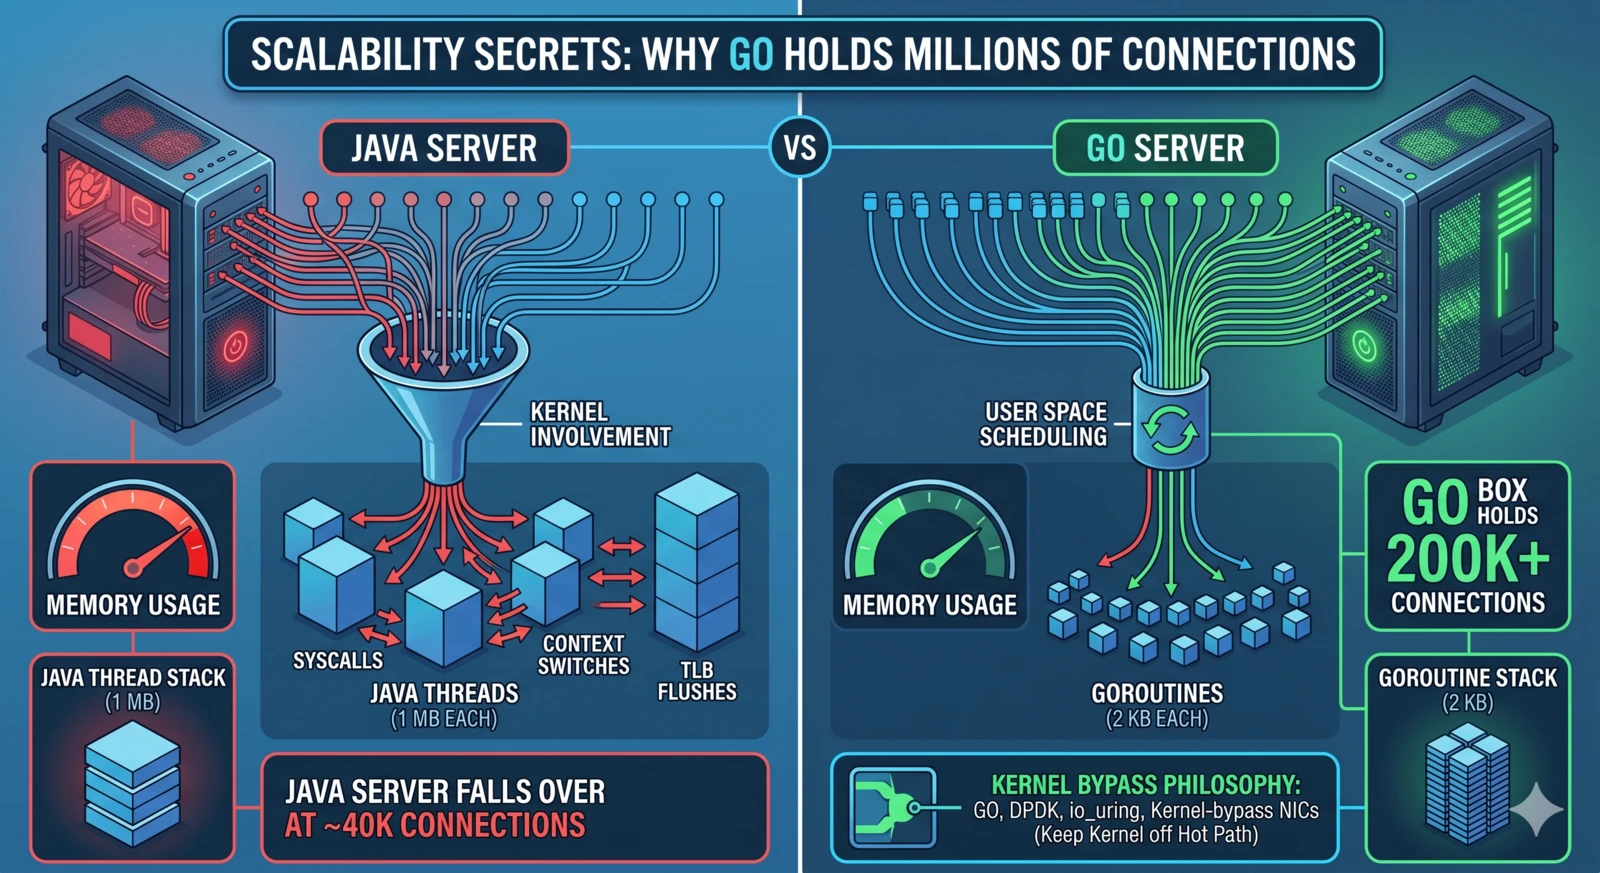
Somewhere around 40,000 concurrent connections, your Java service falls over. Not from CPU, not from network — from memory, because every connection is a thread and every thread wants its own megabyte of stack. By the time you’ve finished Googling whether this is a -Xss problem or a ulimit problem, Ops has already bumped the box to 64 GB and you’ve pushed the wall back another 20,000 connections. Linear in RAM. It never ends.
A Go service on half that box can hold 200,000 connections without noticing. People assume it’s because Go is faster. It isn’t. Per-request, Go and Java are roughly the same — sometimes Java wins. What Go does differently is more fundamental: it stops asking the kernel to help.
tl;dr — High-concurrency isn’t about raw CPU. It’s about how cheaply you can hold an idle connection open. Go’s 2KB goroutine stacks and user-space M:N scheduler push the marginal cost of a connection close to zero. The kernel only gets involved when there’s real I/O to do. This is the same principle HFT engines chase with DPDK and io_uring — Go just hands it to you for free.
The Wrong Mental Model
Most engineers I talk to think “threads are expensive because threading is hard.” That’s not wrong, but it misses the more mechanical reason.
Every time a traditional language (Java pre-Loom, C# pre-async everywhere, classic Python) parks a thread waiting for I/O, it pays two concrete costs:
- Stack memory: Default JVM thread stack is 1 MB. 40,000 threads = 40 GB of stack, most of which is unused.
- Context-switch cost: When the OS swaps the thread, it traps into the kernel, saves the full register set, swaps page tables if there’s an address-space change, flushes TLB entries, and walks the scheduler’s runqueue. Measured on modern x86, that’s 1–5 microseconds per switch, plus the less visible cost of instruction-cache pollution.
Multiply that by tens of thousands of waiters and you’re paying the kernel a rent that has nothing to do with your actual workload.
What Go Does Instead
flowchart TB
    subgraph Java["Java · one thread per connection"]
        JT1["Thread 1
stack ≈ 1 MB"]
        JT2["Thread 2
stack ≈ 1 MB"]
        JT3["Thread ...
stack ≈ 1 MB"]
        JT1 -.->|kernel context switch
TLB flush · reg save| Kernel1[(Kernel scheduler)]
        JT2 -.-> Kernel1
        JT3 -.-> Kernel1
    end

    subgraph Go["Go · goroutines on a small pool of OS threads"]
        G1["Goroutine 1
stack 2 KB"]
        G2["Goroutine 2
stack 2 KB"]
        G3["Goroutine ...
stack 2 KB"]
        G4["Goroutine N
stack 2 KB"]
        Runtime["Go runtime scheduler
M:N · user space"]
        G1 --> Runtime
        G2 --> Runtime
        G3 --> Runtime
        G4 --> Runtime
        Runtime -->|runs on| OST["OS thread 1"]
        Runtime -->|runs on| OST2["OS thread ..."]
        Runtime -->|runs on| OSTn["OS thread GOMAXPROCS"]
    end

    classDef heavy fill:#fed7d7,stroke:#c53030
    classDef light fill:#f0fff4,stroke:#2f855a
    class Java heavy
    class Go light
Go’s concurrency is built on an M:N scheduler. You have many goroutines (N) multiplexed onto a small number of OS threads (M, typically GOMAXPROCS).
Here’s the part that matters:
- A goroutine starts with a 2 KB stack, not a megabyte. Growth is copy-and-resize in user space, triggered by the function prologue when it detects a near-overflow.
- Switching between goroutines happens entirely in the Go runtime. No syscall. No TLB flush. No register-set save-and-restore at OS cost. Roughly a couple hundred nanoseconds in microbenchmarks — an order of magnitude cheaper than an OS-level context switch. The exact number moves around with workload, scheduler contention, and Go version; what’s stable is the order of magnitude.
- When a goroutine blocks on network I/O, the runtime parks it and flips the underlying OS thread to run a different goroutine. The goroutine’s state lives in Go’s own scheduler, not in a kernel wait queue.
This is the actual answer to “why Go scales to millions of connections”: the runtime refuses to hand idle work back to the kernel. The kernel still does the real I/O — Go uses epoll on Linux, kqueue on BSD, IOCP on Windows — but it only involves the kernel when there’s actual work, not when a goroutine is just sitting around.
A Small Benchmark That Tells the Whole Story
Here’s a stripped-down Go program that spins up N goroutines, each one holds a channel read, and prints the total RSS when they’re all parked:
package main

import (
	"fmt"
	"os"
	"runtime"
	"sync"
	"syscall"
)

func main() {
	n := 100_000
	if len(os.Args) > 1 {
		fmt.Sscanf(os.Args[1], "%d", &n)
	}

	var wg sync.WaitGroup
	ch := make(chan struct{})
	wg.Add(n)

	for i := 0; i < n; i++ {
		go func() {
			defer wg.Done()
			<-ch // park forever
		}()
	}

	// Let the runtime settle
	runtime.GC()

	var r syscall.Rusage
	syscall.Getrusage(syscall.RUSAGE_SELF, &r)
	fmt.Printf("goroutines=%d  rss=%d KB  (%.1f KB/goroutine)\n",
		n, r.Maxrss, float64(r.Maxrss)/float64(n))

	close(ch)
	wg.Wait()
}
On my laptop (M1, Go 1.22, macOS):
goroutines=10000    rss=28672 KB   (2.9 KB/goroutine)
goroutines=100000   rss=263168 KB  (2.6 KB/goroutine)
goroutines=1000000  rss=2600960 KB (2.6 KB/goroutine)
2.6 KB per parked goroutine, flat, all the way to a million. That’s the story. Not 1 MB. Not 256 KB. Two and a half KB.
Try the equivalent program with new Thread(() -> ...).start() in Java and you will run out of memory well before 100,000. The comparison isn’t even close, and it isn’t about execution speed — it’s about what an idle waiter costs.
The Parallel in Finance: Same Problem, Opposite Extreme
The part that made this click for me is noticing where else this principle shows up. High-frequency trading engines and exchange colocation boxes have the same bottleneck — kernel context switches are expensive — and they solve it the other way: skip the kernel entirely.
- DPDK gives userspace direct access to the NIC. Packets bypass the kernel network stack.
- Kernel-bypass sockets (Solarflare Onload, AWS Nitro enhanced networking) push the TCP/IP stack into userspace.
- io_uring on modern Linux brings the same idea to general-purpose code — a shared memory ring buffer between app and kernel, batched, with minimal syscalls.
- RDMA lets network cards write directly into another machine’s memory. No kernel on either end.
Different tools, same target: syscalls and context switches are expensive; keep them off the hot path.
Go arrives at the same destination with a completely different route. Instead of bypassing the kernel, it hides the kernel behind a user-space scheduler and only calls in when absolutely necessary. HFT says “the kernel is slow, route around it.” Go says “the kernel is slow, so we’ll handle most of the state ourselves and only ring the kernel’s doorbell when we have real work.” The principle is identical.
Once you see this pattern, you start seeing it everywhere. V8 Isolates. Erlang processes. Rust async runtimes. The details differ but the bet is the same: keep concurrency cheap by keeping it out of the kernel.
Where Go Actually Breaks Under Load
None of this means Go scales forever. When I’ve seen Go services crack at scale, it’s usually not the runtime:
- File descriptors: Default
ulimit -nis 1024 on most systems. You’ll hit this before you stress the scheduler. Push it to 1M if you’re actually building a long-poll service. - Ephemeral ports: If your service fans out to a downstream with lots of short-lived outbound connections, the 28K-ish default ephemeral port range bites before anything else.
- Conntrack tables: Linux’s
nf_conntrack_maxdefault is laughably small for a real service. Tune it or turn it off on high-throughput paths. - GC pressure from allocation-heavy handlers: The scheduler is cheap; the garbage collector is not. Sync pools, stack-allocated buffers, and careful escape analysis still matter.
- The load balancer: Your L4/L7 LB probably caps out before Go does.
I’ve watched a Go service sit happily at 400K connections on a single pod while the upstream Envoy bled under its own CPU budget. The Go process was the calm one.
Concurrency Isn’t a Speed Contest
It’s a cost-of-idleness contest.
If you’re building anything with long-lived connections — streaming APIs, WebSocket fan-out, server-sent events, message brokers, pub/sub gateways, anything with more connections than cores — the question isn’t “is my language fast?” It’s “how much does one idle waiter cost me?”
Go’s answer is 2.6 KB and 200 nanoseconds. That’s why it scales.
If you come from a world where “high concurrency” means “we bought a bigger box,” Go can feel like cheating. It isn’t. It’s just a careful, decade-old design decision that says: the kernel is a system call you should make as rarely as possible, and when you must, do it in bulk.
Further Reading
- The Go Scheduler: Design Principles (Dmitry Vyukov) — runtime internals from a core contributor
runtime/proc.goin the Go source tree — the actual M/P/G logic, shorter and more readable than you’d expect- Dragonfly BSD’s
kqueuepaper — whereepollgot many of its ideas - io_uring introduction (Jens Axboe) — the modern-kernel answer to the same problem Go solved in user space
If you want to understand why the decade-old Go scheduler still holds up, read runtime/proc.go once. The comments alone are worth an afternoon.
🎧 More Ways to Consume This Content
I occasionally advise small teams on backend reliability, Go performance, and production AI systems. Learn more: /services
Comments
This space is waiting for your voice.
Comments will be supported shortly. Stay connected for updates!
This section will display user comments from various platforms like X, Reddit, YouTube, and more. Comments will be curated for quality and relevance.
Have questions? Reach out through:
Want to see your comment featured? Mention us on X or tag us on Reddit.