The Decoder Kept One Frame for Itself
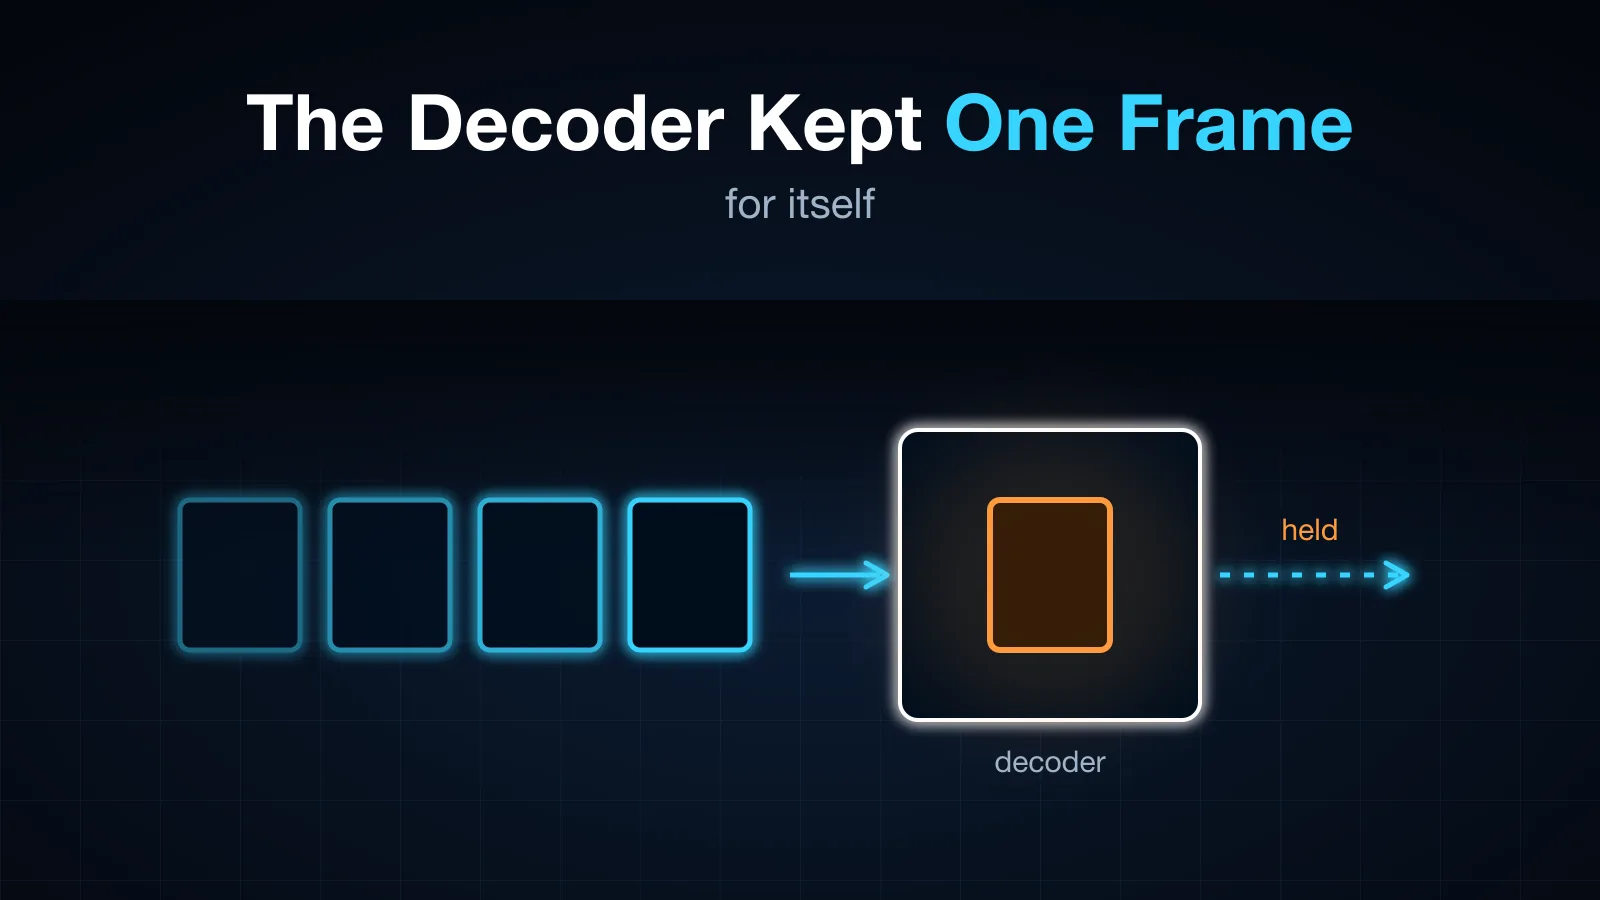
A GPU transcoder added 26 ms on average and up to five seconds at the 95th percentile, and only when the screen was nearly still. A hardware H.264 decoder was holding the last frame of every burst until the next one arrived, which on a phone screen can be never. How a replay probe found it, which decoders do it, and what switching cost.
Table of Contents
My second iPhone lives at home and I use it over a stream (the setup). The phone’s own H.264 comes off USB at 20 to 50 Mbit/s, and the laptop’s integrated GPU decodes and re-encodes it to a few Mbit/s so it survives a cellular link.
The report was vague: sometimes the sound and the picture are out of sync. I had just fixed one audio-drift bug (that story), so I checked the audio path first. It was clean: no drops, no backlog. This time the picture was the late one.
The number that looked fine
The transcoder already logged its own added latency every five seconds: time from a frame arriving to its re-encoded version leaving. The median was 26 ms. Fine.
The 95th percentile was 1 to 5 seconds. Not fine. And it was only bad in one condition: when the input was running at 1 to 7 frames per second.
Why the input is sometimes nearly still
The phone does not always send 60 frames a second. Over USB, iOS hands over screen frames only when the screen changes, unless the capture request carries a key called Valeria. With Valeria set, the phone streams continuously at 60 fps, and also switches its status bar to Apple’s demo mode, with the time frozen at 9:41. I had removed the key a few days earlier because the phone at home kept showing the wrong time.
So now a phone at rest sends nothing. A tap that scrolls a list sends a burst of frames, then nothing again. Reading, which is most of what you do on a phone, is a series of short bursts separated by silence.
The 95th percentile was the last frame of each burst.
A probe that replays real frames slowly
To find which element was holding on, I wanted the phone’s real stream, not a test pattern, fed in slowly enough that any hold would be obvious. The probe:
- records a few hundred compressed frames from the live USB feed, starting at a keyframe;
- pushes them into a candidate pipeline one every 0.5 seconds;
- timestamps every frame that comes out;
- for each output, counts how many later inputs went in before it appeared.
A pipeline that holds nothing outputs every frame a few milliseconds after it goes in. A pipeline that holds one frame outputs each frame only when the next one is pushed: its latency is the gap, 500 ms, and its held count is 1.
# output k belongs to input k (nothing is dropped); held = later inputs it waited for
lat  = [o - i for i, o in zip(ins, outs)]
held = [sum(1 for t in ins if i < t <= o) for i, o in zip(ins, outs)]
Who held what
Intel HD 515, GStreamer 1.24.2, the phone’s own stream:
| Pipeline | Frames held | Latency, 1 frame / 0.5 s | Latency at 54 fps | CPU (one core) |
|---|---|---|---|---|
h264parse alone | 0 | 0 ms | ||
vah264dec (any compliance) | 1 | 509 ms | 27 ms | 14% (with vah264lpenc) |
qsvh264dec / openh264dec | 3 / 1 | |||
vaapih264dec low-latency=true → vah264lpenc | 0 | 30 ms | 28 ms | 58% |
vaapih264dec low-latency=true → vaapih264enc | 0 | 9 ms | 8 ms | 10% |
h264parse alonevah264dec (any compliance)vah264lpenc)qsvh264dec / openh264decvaapih264dec low-latency=true → vah264lpencvaapih264dec low-latency=true → vaapih264encThe decoder I had been using, vah264dec from GStreamer’s newer va plugin, decoded each frame on arrival but only output it when the next picture was inserted into its buffer. Changing compliance made no difference. Appending an access unit delimiter after each frame, which tells a parser a frame is complete, did not help either: the frame was complete; the decoder was choosing to keep it.
At 54 fps that hold costs 27 ms and nobody would ever notice. At the end of a burst it costs however long until the screen changes again. On a phone you are reading, that can be minutes.
The older vaapi plugin’s decoder, with low-latency=true, outputs each frame as soon as it is decoded. It held nothing.
The price of switching
Two catches, both visible in the table.
Mixing plugins is expensive. The new decoder with the old encoder worked but cost 58% of a core, because frames from one plugin cannot be handed to the other on the GPU; they were copied through system memory. The fix was to move the encoder to the same older plugin: vaapih264enc, 10% CPU, 8 ms.
The older encoder cannot change its quality while running. It only does constant-QP on this GPU, and it reads the QP once, at start. My rate control works by changing QP when the bitrate is too high for the link. The answer was to replace the encoder element itself, live:
// block the decoder's output, swap the encoder, unblock
pad.add_probe(gst::PadProbeType::BLOCK_DOWNSTREAM, move |pad, _| {
    let new = make_enc(qp, gop).unwrap();       // vaapih264enc with the new init-qp
    let old = current_encoder();
    pad.unlink(&old.static_pad("sink").unwrap());
    old.set_state(gst::State::Null);
    old.unlink(&caps_filter);
    pipeline.remove(&old);
    pipeline.add(&new);
    new.link(&caps_filter);
    pad.link(&new.static_pad("sink").unwrap());
    new.sync_state_with_parent();
    gst::PadProbeReturn::Remove
});
(Simplified: the real version handles errors and keeps the current encoder behind a lock.) Every new encoder starts with a keyframe and fresh SPS/PPS at the new QP, so the client switches cleanly and no frame is lost. A side benefit: this encoder honours force keyframe requests, which the newer one had ignored.
After
End to end, the last frame of each burst now leaves the transcoder 8 to 11 ms after it arrives. Before, it left when the next burst began. The same change went into the second consumer of the phone’s stream, the gateway’s “eye” that watches the screen to find and tap dialogs, which had been looking at a screen one change out of date.
What I would do differently
- Look at the tail, by input rate. The median was 26 ms and true. The bug lived entirely in the 95th percentile, and only at low frame rates. Splitting the latency figure by how fast frames were arriving would have pointed at it on day one.
- Test with the input you actually have. Every decoder benchmark feeds 30 or 60 fps. A screen-sharing stream is bursty and mostly idle, and a one-frame hold that is invisible in a benchmark is the whole bug here.
- Replay real data, slowly. A probe that pushes recorded frames at a controlled pace and counts held frames per element answered in minutes what reading plugin source would not have.
- One hidden setting changes the input shape. Removing a key to fix the status bar clock turned a 60 fps stream into a bursty one, and exposed a decoder behaviour that had always been there.
🎧 More Ways to Consume This Content
I occasionally advise small teams on backend reliability, Go performance, and production AI systems. Learn more: /services
Comments
This space is waiting for your voice.
Comments will be supported shortly. Stay connected for updates!
This section will display user comments from various platforms like X, Reddit, YouTube, and more. Comments will be curated for quality and relevance.
Have questions? Reach out through:
Want to see your comment featured? Mention us on X or tag us on Reddit.