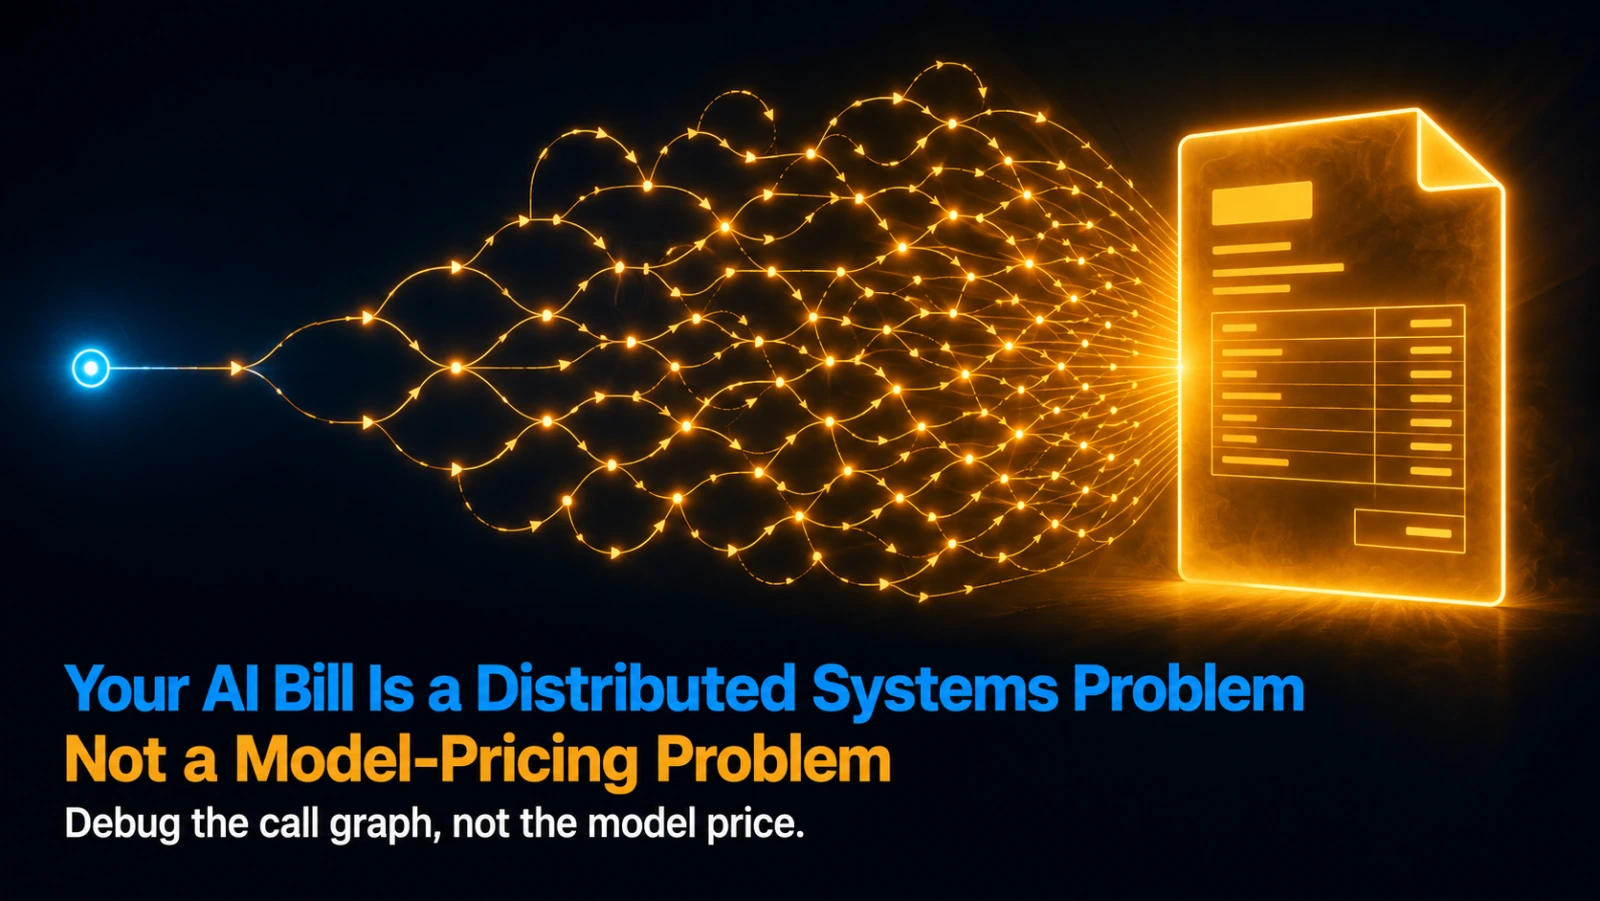
Your AI Bill Is a Distributed Systems Problem, Not a Model-Pricing Problem
When the monthly LLM bill jumps several times over, the first instinct is that the model got more expensive or usage simply grew. It is almost always something else: a distributed systems failure mode, retry storms, fanout amplification, cache misses, unbounded conversation growth, that happens to be denominated in tokens instead of network calls. Debug the call graph, not the model price.
Table of Contents
A team I was helping watched their model bill jump to several times its usual size in a single month. The token meter had not predicted it. The first question in the room was the one almost everyone asks: did the provider raise prices, or should we move to a cheaper model?
Both were the wrong question, and they were wrong in an instructive way. The same engineers, if their AWS egress bill had tripled, would never have opened with did AWS raise prices. They would have asked what is calling more, pulled up the request graph, and started looking for the amplification. The instinct is correct and automatic when the unit is HTTP calls. It deserts people the moment the unit becomes tokens.
That gap is the whole subject of this piece.
A surprising AI bill is a symptom. The disease is almost always a distributed systems bug, a retry storm, a hidden fanout, a cache that stopped hitting, a conversation that grows without bound, that you would recognize instantly if it were denominated in network calls instead of tokens. Debug the call graph, not the model price.
This sits in the same first-principles line as determinism where you can, judgement where you must and validation is a loop, not an assertion. Where those are about correctness, this one is about cost, and the move is the same: take a problem that looks new because it wears an AI costume, and recognize the old shape underneath. On the architecture side it pairs with Observability and Billing for AI API Calls, which is about how to build the telemetry. This piece is about how to read it when the number jumps.
The diagnostic flip
When a backend engineer’s egress bill spikes, the reflex is to ask what changed in the call graph. Nobody’s first move is to email the vendor about pricing. When an AI engineer’s model bill spikes, the reflex too often inverts: the first suspects are the price sheet and the model choice, and the call graph is the last thing anyone looks at.
These are the same question wearing different clothes. What is driving the spend, and is the driver behaving the way it should? We get it right for HTTP because we have years of muscle memory in that unit. We get it wrong for tokens because the unit is unfamiliar and, crucially, because the bill arrives pre-aggregated into a single dollar figure that hides the graph that produced it. The dollar figure is the least useful view of the problem, and it is usually the only view people start from.
So before anything else, refuse the pricing question. Assume the spend is a downstream-service spend that misbehaved, and go find the misbehavior. It will almost always be one of five shapes.
Five failure modes, denominated in tokens
1. Retry storms. A transient provider error triggers a retry at the SDK layer, and again at the agent layer, and again at the workflow orchestrator, because all three were written to be resilient and none of them knew about the others. One user request becomes several billed calls. This is the exact retry storm you have debugged on a degraded downstream HTTP service, where nested retry policies multiply instead of coordinate. The fix is the same: one retry budget, owned in one place, not three hopeful ones stacked.
2. Fanout amplification. An agent spawns several parallel tool calls, and each tool, somewhere inside its implementation, makes its own model call to parse or summarize its result, and each of those results feeds back into the main conversation. One user request quietly becomes many model calls, and most of them are hidden inside tool code where no one thinks to look. This is request fanout amplification, the same reason a single page load can trigger forty backend calls when each component fetches for itself.
3. Cache misses where caches should hit. The provider supports caching a stable prompt prefix, and you are not using it, so the same system prompt and the same long preamble get retokenized and rebilled on every single call. This is a CDN accidentally configured to pass every request through to origin. The content never changed, and you paid to recompute it anyway, every time.
4. Unbounded conversation growth. Conversation history is appended turn after turn with no compaction, so the tokens billed per turn grow with the length of the session, and the total cost of a session grows quadratically with its length. This is an unbounded buffer, the same class of leak that treating a channel like message passing produces, except the buffer is a transcript and the leak shows up on an invoice instead of in a heap profile.
5. Wrong model for the job. A frontier model is doing work a smaller model handles perfectly well, on every call, by default. This is running your ad-hoc analytical queries against the transactional cluster because it was the connection string you had, instead of against the warehouse built for them. It is also, in the language of the technique boundary, using the most expensive technique where a cheaper one was sufficient, which is the cost face of the same mistake that piece describes for correctness.
Four of these five are amplification bugs: something is producing more calls, or more tokens per call, than the work requires. The fifth is a tiering mistake. None of them is a price change, and none of them is fixed by switching models, which is exactly why switching models first tends to disappoint.
The forensics, in order
The diagnosis runs in the same order every time, and each step reads a distributed systems metric off the call graph, not a number off the token meter.
1. Calls per user request
   near your workflow's theoretical minimum? -> healthy
   several times the minimum?                -> retry storm or hidden fanout (modes 1, 2)

2. Tokens-per-call distribution
   stable week over week?                    -> healthy
   the tail is climbing?                     -> unbounded conversation or uncached prefix (modes 3, 4)

3. Model mix over time
   right tier per task type?                 -> healthy
   a routing change shifted traffic up?      -> wrong model / tiering (mode 5)

4. Provider reject rate
   negligible?                               -> healthy
   climbing?                                 -> the trigger that sets off mode 1
The order matters. Provider rejects sit at the bottom of the list but at the root of the causal chain, because a rise in transient rejects is what ignites a retry storm at the top of it. Read the graph top to bottom to localize the symptom, then bottom to top to find the cause.
The point of laying it out this way is that none of it is novel. Your observability stack already knows how to compute calls per request, tail distributions, traffic mix, and error rates. You compute them for every other downstream service you depend on. The only new thing is pointing that same machinery at the model provider.
flowchart LR
  U[User request] --> AG[Agent]
  AG -->|fanout x N| T[Tool calls
each hides a model call]
  T -->|retries x R| P[Provider
cache layer]
  AG -->|retries x R| P
  P --> B([The bill])
Every multiplier on an edge in that graph is a place the bill can balloon while the price per token never moves. The invoice only shows you the node at the far right. The leak is always on an edge.
Billing is not cost forensics
Here is the line that decides whether you can do any of the above. If your AI observability emits tokens multiplied by price for each call and stops there, you have billing. You know what you paid. You cannot see why, because the why lives in the edges of the call graph, and a per-call token count has thrown the graph away.
Cost forensics needs the graph kept intact: calls attributed back to the originating user request, fanout factors per tool, cache hit rates per prompt prefix, retry distributions per layer, model mix over time. That is the same telemetry shape you already maintain for HTTP dependencies, and building it deliberately is the subject of the T-shaped architecture piece. The relevant point here is diagnostic: if that data does not exist, no one, however senior, can tell you where your bill is leaking, because the evidence was discarded at collection time. Add the graph, and an engineer who has never touched an LLM but is good at HTTP cost forensics can find the leak, because a token is just a byte with cognitive content, and a model provider is just a downstream service that bills by the payload.
When a model switch is actually the answer
Not never. After you have ruled out retries, fanout, cache misses, and conversation growth, mode five is a real and common diagnosis, and moving a class of calls to a smaller model is the right fix. The discipline is only about order. Switch models before ruling out the amplification modes and you can land on a cheaper model that still has a retry storm sitting on top of it, which presents as the smaller model being mysteriously expensive too, and now you have two confusing bills instead of one. Rule out the graph problems first. Then a model switch is a measurement-backed decision rather than a hopeful guess, and it tends to hold.
The old hygiene, new invoice
If your team has someone with good instincts for HTTP retry budgets, request fanout, cache hit ratios, and payload-size distributions, that person can already debug your model bill. Everything transfers. Retry budgets are retry budgets. Fanout is fanout. An uncached prefix is an uncached prefix. The provider is one more downstream service that responds to the same hygiene you already apply to object storage, managed databases, and third-party APIs.
The bill is the last place the bug appears and the most expensive place to read it, because by the time it shows up there it has already been paid. Read it one step earlier, in the call graph, where every one of these five modes is visible as a multiplier on an edge, and where you have known how to fix each of them for years. Your AI bill is not a new kind of problem. It is an old kind of problem with an unfamiliar unit, and the moment you convert the unit back, you already know what to do.
This piece sits in the Generative Systems, First Principles line. The correctness companions: Determinism Where You Can, Judgement Where You Must and Validation Is a Loop, Not an Assertion. The architecture companion: Observability and Billing for AI API Calls.
🎧 More Ways to Consume This Content
I occasionally advise small teams on backend reliability, Go performance, and production AI systems. Learn more: /services
Comments
This space is waiting for your voice.
Comments will be supported shortly. Stay connected for updates!
This section will display user comments from various platforms like X, Reddit, YouTube, and more. Comments will be curated for quality and relevance.
Have questions? Reach out through:
Want to see your comment featured? Mention us on X or tag us on Reddit.